2022 Fiscal Year Financials

Illustration of a purple and blue heart in front of golden sun rays
When you invest in what you care about, you touch lives. Thank you for being a part of the change you want to see in the world.

Thank you for asking, “Why not?”
Illustration of a purple and blue heart in front of golden sun rays

2022 fiscal year financials

When you invest in the causes you care about, you touch lives. Thank you for being a part of the change you want to see in the world.

Thank you for asking: “Why not?”

Here’s how your gifts make an impact.

$377.2 million given last year

Every gift creates positive change in the world. You might help veterans feel at home on campus, open doors for first-generation college students, aid important environmental science in Antarctica or advance infectious disease research.

Read impact stories
illustration of a person leaning against the base of a tree reading a book. There are yellow line drawings of globes, atoms, beakers and a light bulb in the background.

69,042 gifts

Every gift is a choice that shows you believe you can make the world a better place. In 2022, donors like you gave 69,042 gifts. That translates to better outcomes for students, more discoveries and more lifesaving health care.
Last year, you gave:

 Illustration of a flat cap and diploma

$65 million

Scholarships and fellowships

Illustration of a telescope

$137 million

Research and discovery

Illustration of an open book with pages flipping

$43 million

Faculty recruitment and retention

Illustration of a heart with a DNA strand behind it

$180 million

Health care and lifesaving treatment

When the CU community invests, the possibilities are limitless.

44,489 donors like you
 Illustration of a gift box with a pie chart behind it.

93% of gifts were less than $2,500

A pair of open hands reaches for a heart that floats above them.

The average size of a gift was $5,463

Compared with 2021, nearly 15,000 more donors gave to CU in 2022.

Last year we received gifts from:

14,855

Alumni

2,789

Parents

8,651

Friends

2,104

Corporations and foundations

1,192

Faculty and staff

Illustration of several mountain peaks with a curving road running up the highest peak. A sun is rising through the clouds behind the mountain.

Investing in tomorrow

An endowment is a gift that creates returns for tomorrow and provides a rich legacy for future generations. When donors invest in endowments, they help the university build programs, create scholarships and retain faculty.

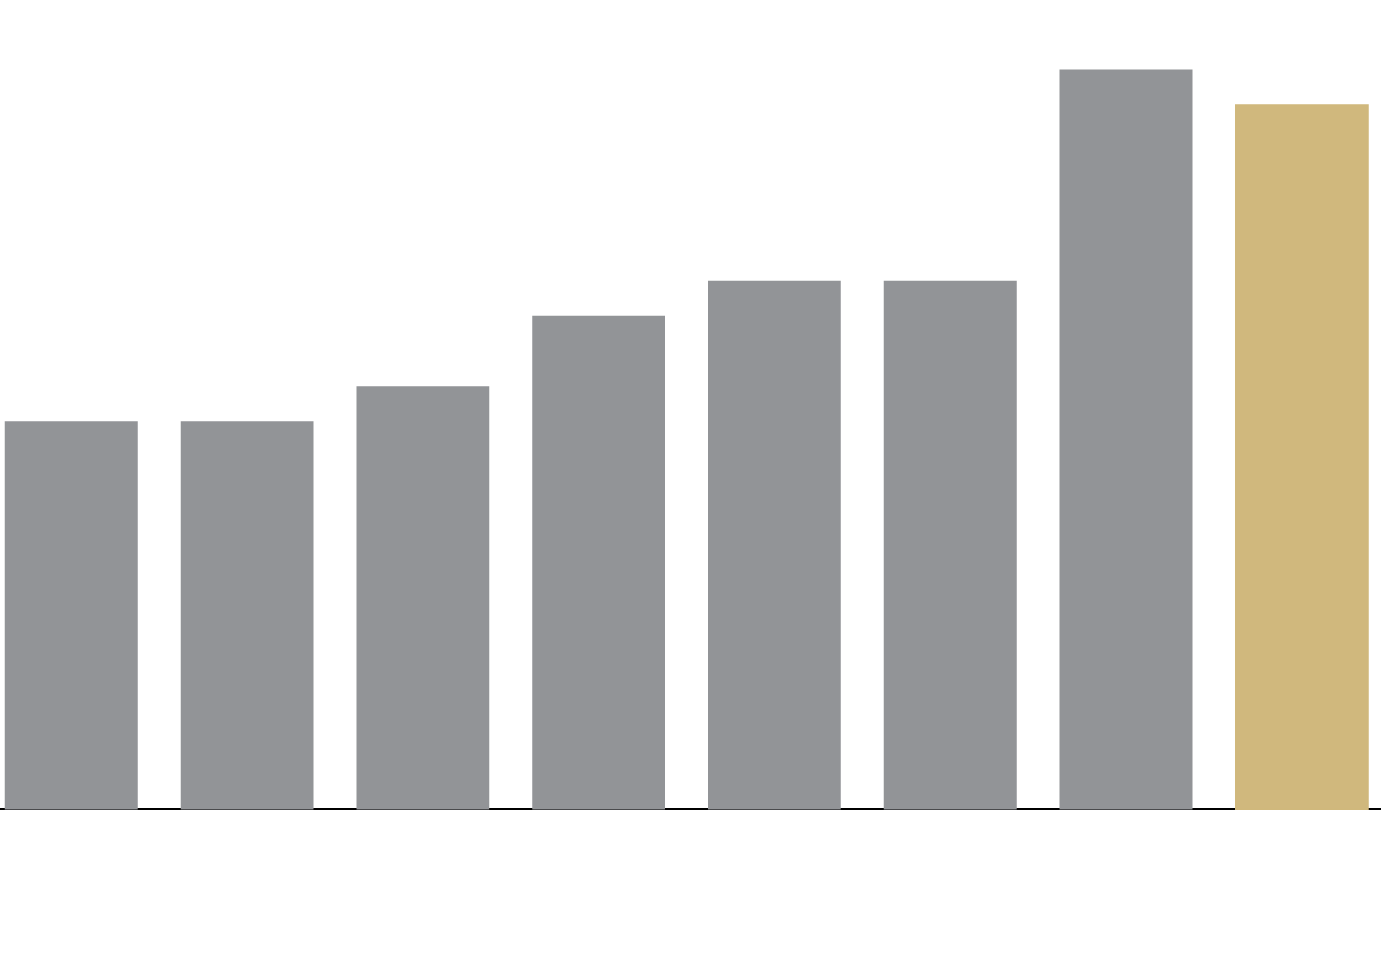
As an important part of the university’s long-term strategy, CU’s collective endowment is made up of more than 3,000 individual endowments. Here’s a look at the endowment’s value at the end of each fiscal year.  

CU Endowment over time

139 new endowments were created in the last fiscal year
3,298 total endowments at CU
$71 million was given in endowment support

Here is the value of the endowment as of June 30 each year in billions.

This is a bar chart that shows the value of the CU endowment by year. Here are the values: $1.1 billion for 2015, $1.1 billion for 2016, $1.2 billion for 2017, $1.4 billion for 2018, $1.5 billion for 2019, $1.5 billion for 2020, $2.1 billion for 2021 and $2.0 billion for 2022.
This is a donut chart that shows how the Long-Term Investment Pool is invested in asset classes. 39% for global public equities, 28% for global private capital, 15% for global hedge funds, 13% for real assets and 5% for fixed income and cash.
Global public equities (39%)
Global private capital (28%)
Global hedge funds (15%)
Real assets (13%)
Fixed income and cash (5%)

How is the endowment allocated?

CU's endowment is invested in a diversified portfolio to promote stable, long-term growth. Here is the proportion of investment by asset class in fiscal year 2022.

Investment return vs. policy benchmark

Our Long Term Investment Pool has outperformed benchmarks over time. Here’s how:

LTIP
Policy Benchmark
This is a dual bar chat that compares the Long-Term Investment Pool (LTIP) and policy benchmark returns. Here are the percentage returns: 1 year for LTIP is -6.3%, 1 year for benchmark -14.6%, 3 year for LTIP is 10.1%, 3 year for benchmark is 4.9%; 5 year for LTIP is 8.5%, 5 year for benchmark is 6.1%; 10 year for LTIP is 9.4%, 10 year for benchmark is 7.9%; 15 year for LTIP is 6.8%, 15 year for benchmark is 5.1%.
This is a donut chart that shows where support from the CU Foundation to CU goes, by percentage. Academic Support 37%; Advancement support 15%; Scholarships 13%; Capital Projects 12%; Chairs, Professorships and Other Faculty Support 10%; Research 9%; Public Service, Administration, Library and Other Support 2%; and Athletics 1%.
Academic support (37%)
Advancement support (15%)
Scholarships (13%)
Capital projects (12%)
Chairs, professorships and other faculty support (10%)
Research (9%)
Public service, administration, library and other support (2%)
Athletics (1%)

$234.03 million

Total transferred to CU from the CU Foundation

Find out more about your investments in CU.

Donors like you advanced CU’s mission with support from all corners of the CU community. Learn more by taking a deep dive into the 2022 financials.